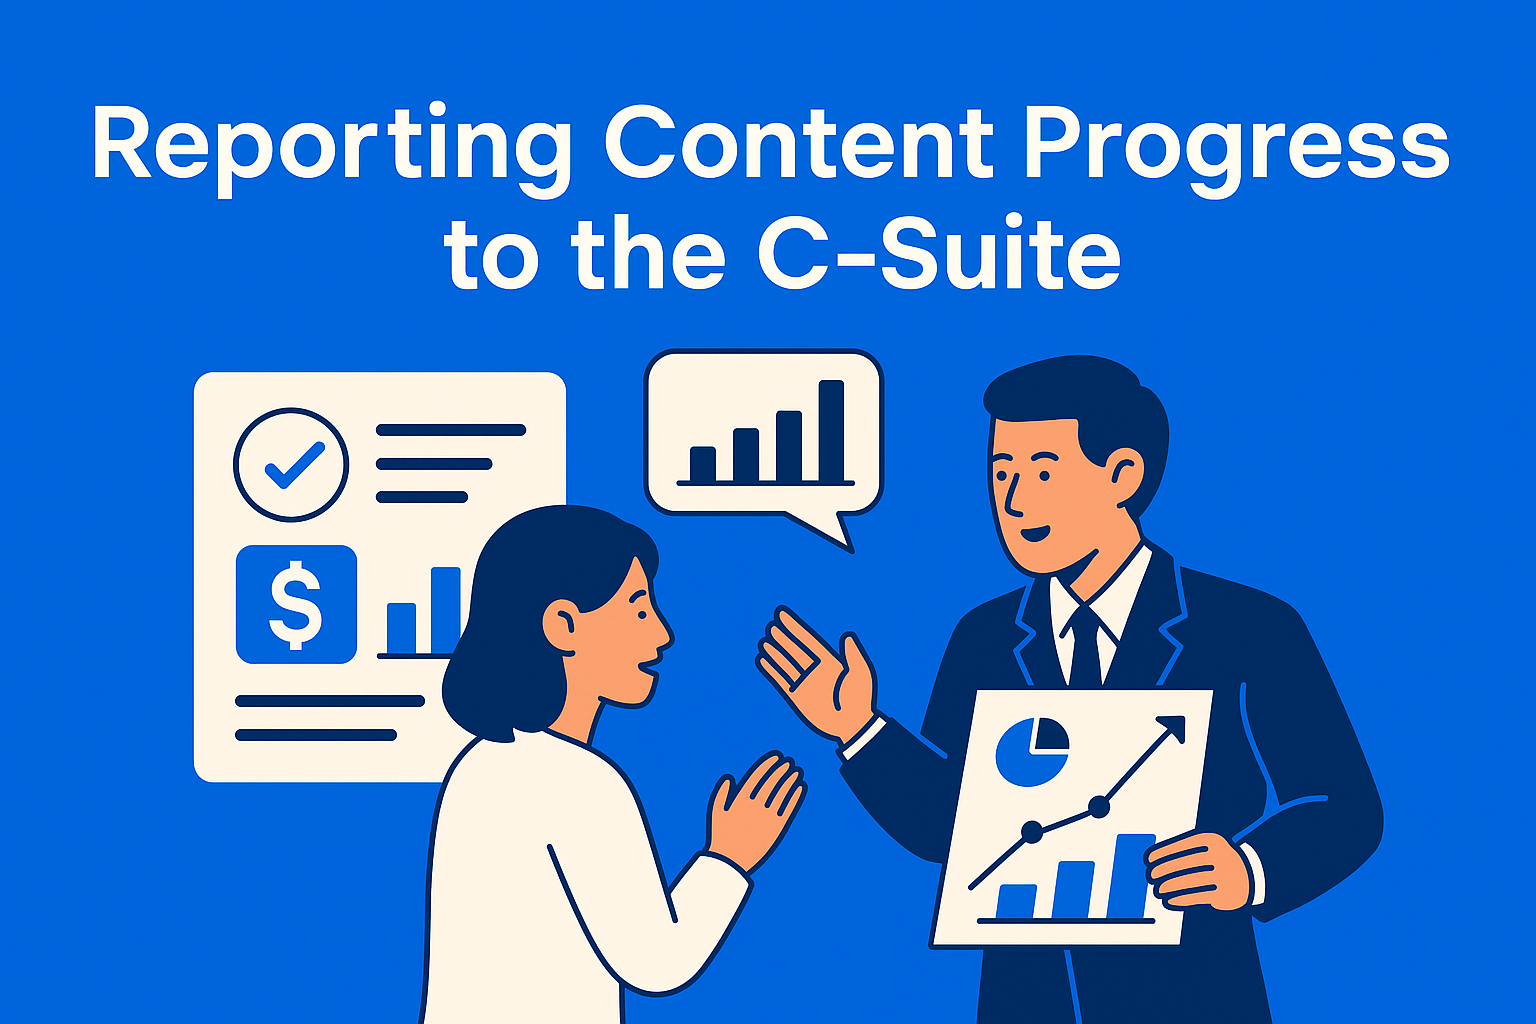
Reporting Content Progress to the C-Suite: What They Actually Want to See
Learn how to report content progress to the C-Suite without wasting their time. Discover what metrics truly matter, how to link content to business goals, and why tools like EasyContent make reporting faster and easier.

If you’ve ever tried explaining your content operations to the C-Suite, you know how challenging it can be. They don’t have time for detailed SEO analysis or a 20-slide breakdown of how many blog posts you’ve published. They care about one thing: does your content drive business results, and how does it impact the bottom line at the end of the quarter?
In this article, we’ll discuss why it’s essential for the C-Suite to have visibility into your content efforts, what they truly care about (spoiler: it’s not word count), and how you can present this information clearly and quickly.
Key Takeaways
- Speak their language - Focus on ROI, pipeline impact, and business outcomes, not tactical details.
- Big picture over micro-metrics - Avoid overwhelming slides with bounce rates and traffic charts.
- Show clear connections to revenue - Translate metrics into financial impact (e.g., “Traffic +30% = 10 new SQLs”).
- Visual and concise - One-page dashboards or summaries with key highlights work best.
- Plan ahead - Include forecasts, next steps, and risks to position content as a strategic driver.
Why Should the C-Suite See Your Content Progress?
The C-Suite doesn’t care about details like “how many posts you published last week.” What matters to them is how content contributes to business growth. Here’s why they need visibility:
- Alignment with strategy: Content isn’t just a marketing story. It drives leads, impacts revenue, reduces CAC, and builds brand trust.
- Transparency and trust: If you can’t show a clear picture, your budget (and your team) might be the first to get cut.
- Resource planning: When they see where content delivers results, it’s easier to justify investments in people and tools.
Bottom line: if you don’t connect content to revenue, it looks like a cost - not an investment.
Why Standard Reporting Doesn’t Work for the C-Suite
The biggest mistake? Overloading them with details. Slides packed with metrics like bounce rate or average session duration mean nothing to them.
They want the big picture, and you’re giving them too many small details.
Too much focus on output instead of outcomes. It’s not about how many blogs you’ve published - it’s about what those blogs deliver to the pipeline. Missing context. Saying traffic is up 20% means nothing if you don’t explain what that adds to revenue. Too much tactics, not enough strategy.
C-Suite executives are visionaries - give them the vision, not a task list.
What Do They Actually Care About?
Here’s what the C-Suite wants to see in your report:
- Connection to business goals: How does content drive revenue, pipeline, and acquisition? Example: “SEO content contributed to 15% more MQLs in Q2.”
- ROI and efficiency: How much does it cost vs. how much does it deliver? Is content reducing reliance on paid campaigns?
- Trends and forecasts: Are we moving in the right direction? What’s next quarter looking like?
- Risks and opportunities: Is a new AI tool speeding up production? Could a Google update hurt our traffic?
- Highlights: Top 3 wins + top 3 next steps. Everything else can go in the appendix.
If your report doesn’t include these, it’s time to rethink it.
How to Format Reports to Respect Their Time
Keep it simple: one page for the essentials, with visuals over text.
Start with an executive summary, one slide that shows KPIs tied to business goals. Follow with charts and dashboards for trends, ROI, and pipeline contribution. Translate numbers into business value. Don’t write “+30% traffic” write “+30% traffic = 10 new SQLs.” Finally, add scenario planning, “If we invest X, we expect Y.”
Practical Example: A Mini Template
Title: “Q2 Content Impact Overview”
- Highlights:
- Organic traffic 25% - saved $10K in paid ads
- Blog series X delivered 15% more MQLs
- LinkedIn engagement grew 40%, supporting ABM campaigns
- Metrics:
- CAC down by 12% thanks to SEO content
- Best-performing format: case studies (+20% conversion rate)
- Next Steps:
- Focus on ABM content for Q3
- Refresh older posts for an SEO boost
This template gives them a clear picture without wasting time on operational details.
Conclusion
If you want the C-Suite to pay attention, your reports need to be clear and simple. Don’t overload them with details; show what matters most: how content impacts revenue, goals, and ROI. Use visuals and short summaries so they get the point right away.
Your job is to connect content with business results. When you prove that your work delivers measurable outcomes, content becomes a key growth driver, not just a cost. In short, tell a data-backed story and make your report a decision-making tool, not just a status update.


